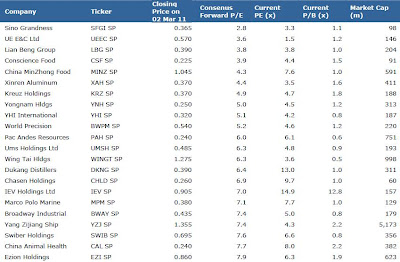
There are many kinds of financial ratios that can be applied to try to identify value in stocks. One of the most common is PE, which relates the stock price to the earnings power of the company. Generally, the lower the PE, the better the value. A PE of five indicates that the current stock price is five times its annual earnings per share and if the company is able to sustain the current level of profits, investors will take five years to cover their cost assuming the company pays out all their earnings as dividends. PE multiples of stocks can also be used to compare valuations. The ease of computation has made PE ratio analysis popular among investors. But having said that, a low valuation may not fully justify an investment as they may not reflect the company's future growth prospects. But in some cases, PEs could be lower since growth is expected to be sluggish or negative either because of company-specific issues or due to concerns that impact the whole sector or the economy.
To aid investors, we select 34 most
frequently traded stocks for the month and analyse their technical outlook. We believe combining fundamentals and technicals will increase the probability of achieving returns. On the next page are three stocks that look attractive with technical indicators at current valuation.
Click To Enlarge
Pacific Andes Resources Development (PAH SP, P11) – Technical BUY with +18% potential return
Last price: S$0.24
Resistance: S$0.285
Support: S$0.23
BUY with a target price of S$0.285. The stock has retraced from our previous technical BUY target of S$0.285 and could rebound from the lower Bollinger band. The Stochastics indicator has crossed above its signal line in the oversold region. Alternatively, investors may exit their longs if prices move below S$0.230.
Armstrong Industrial Corp Ltd (ARMS SP, A14) – Technical BUY with +16% potential return
Last price: S$0.30
Resistance: S$0.35
Support: S$0.285
BUY with a target price of S$0.35, preferably near the support level. The stock has retraced towards the 50-day EMA, which coincides with the longer 200-day EMA and may rebound from there. Do keep an eye on the Stochastics indicator for a crossover signal as the indicator has reached the oversold region. Alternatively, investors may exit their longs if prices move below S$0.275. Our retail research has a fundamental HOLD with a target price of S$0.30.
Kreuz Holdings (KRZ SP, 5RK) Technical BUY with +11% potential return
Last price: S$0.37
Resistance: S$0.41
Support: S$0.355
BUY with a target price of S$0.41, preferably near the support level. The stock has retraced from our previous technical BUY target of S$0.41 and is likely to find support near the lower Bollinger band before a possible rebound. The Stochastics indicator has crossed above its signal line in the oversold region. Alternatively, investors may exit their longs if prices move below S$0.345. Our retail research has a fundamental BUY with a target price of S$0.44.


No comments:
Post a Comment